The Exam Results module provides a detailed overview of student performance on all assessments. This comprehensive view allows teachers to track individual student progress, analyze assessment effectiveness, and identify patterns in academic achievement.
Key Features
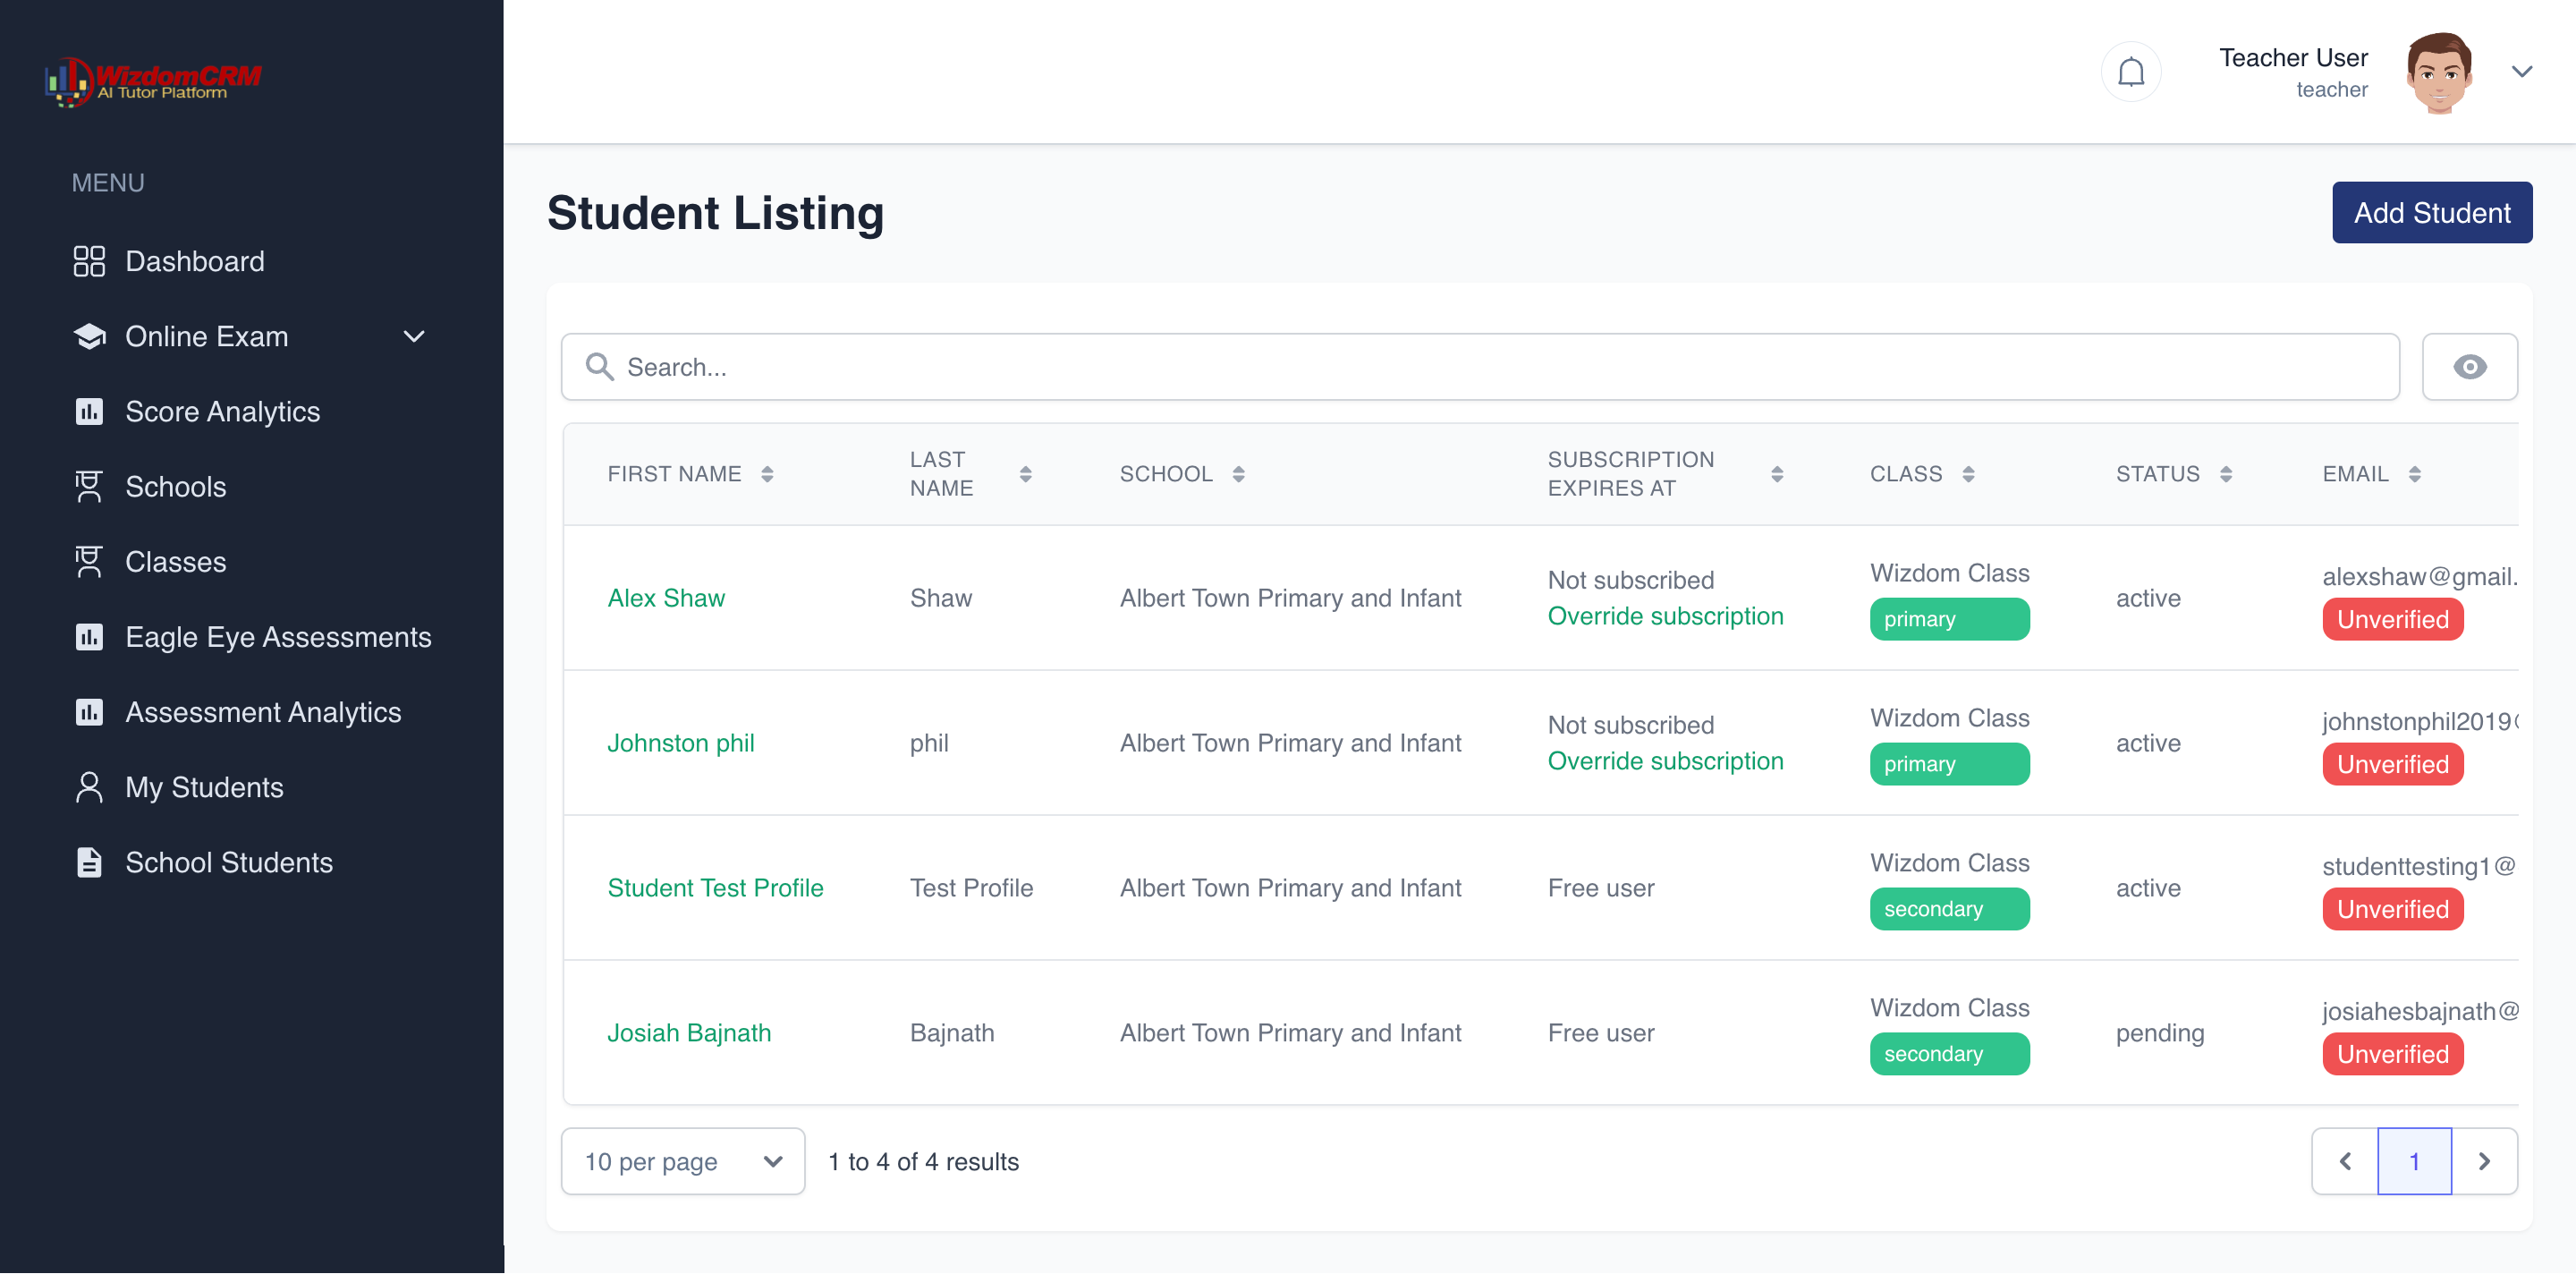
Results Table
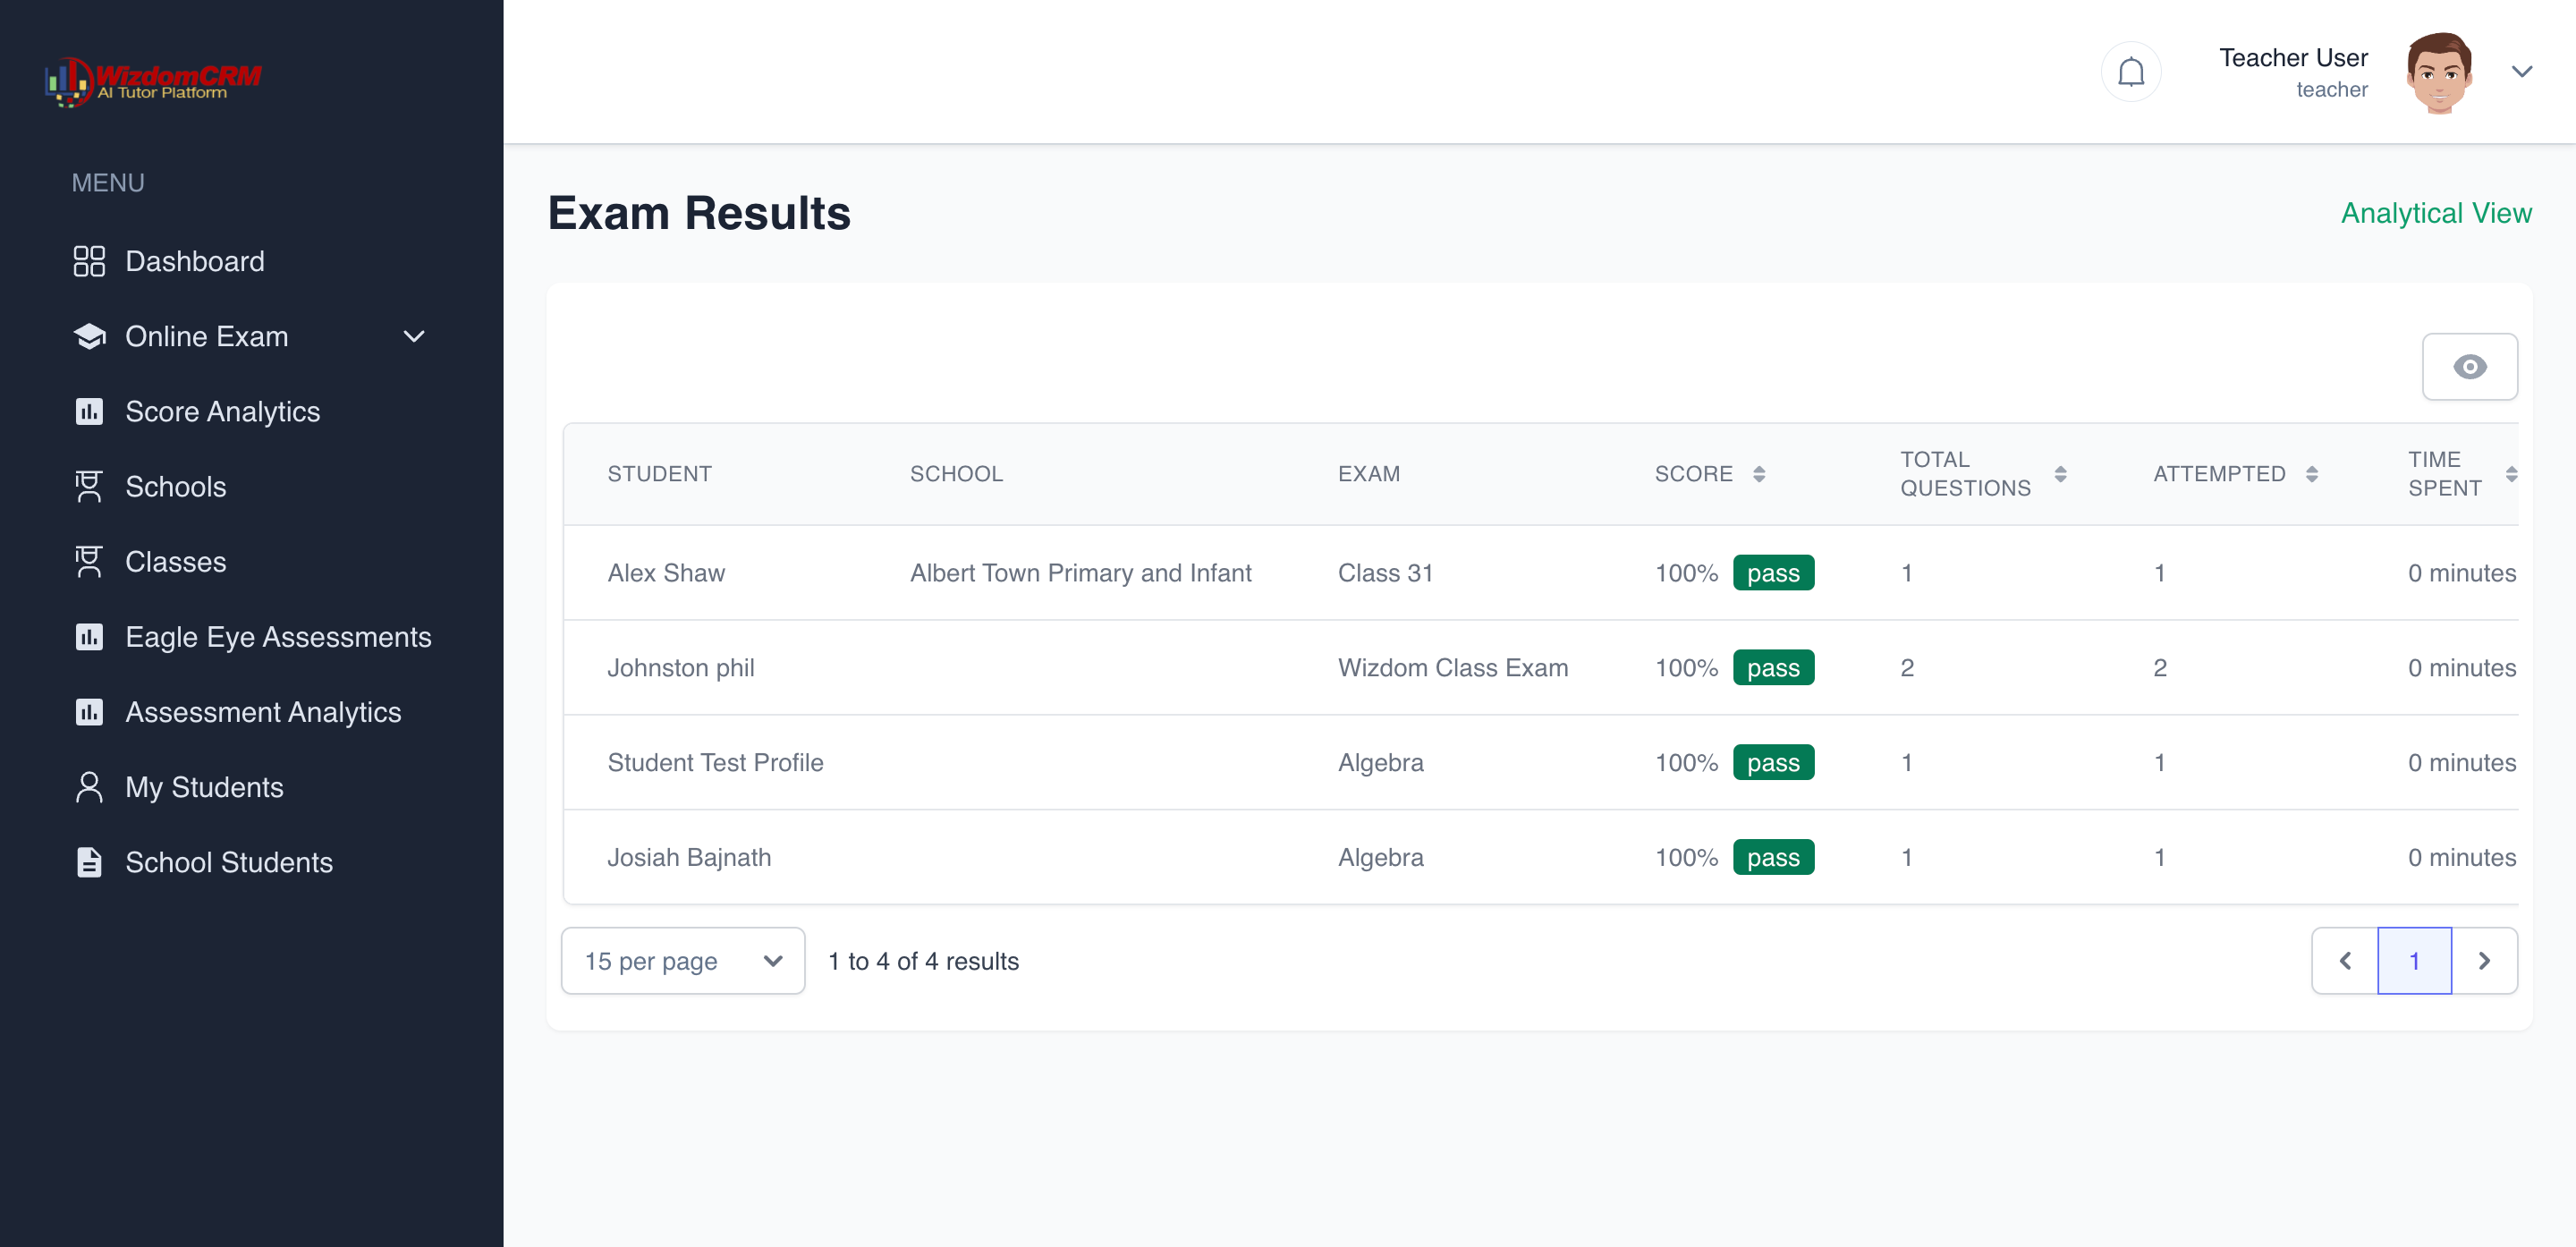
The main component is a detailed table displaying exam results with the following columns:
- Student: The name of the student who took the exam
- School: The school the student is affiliated with
- Exam: The name/title of the exam taken
- Score: The percentage score achieved (with pass/fail indicator)
- Total Questions: The number of questions in the exam
- Attempted: The number of questions the student attempted
- Time Spent: The duration the student spent completing the exam
In the example shown, we can see several students with their exam results:
- Alex Shaw: 100% on Class 31 exam (Albert Town Primary and Infant)
- Johnston phil: 100% on Wizdom Class Exam
- Student Test Profile: 100% on Algebra
- Josiah Bajnath: 100% on Algebra
All students shown have achieved perfect scores (100%) and are marked as "pass". Each exam had 1-2 total questions, all of which were attempted. Interestingly, the time spent is recorded as "0 minutes" for all exams, which may indicate either very quick completion or a potential issue with the time tracking feature.
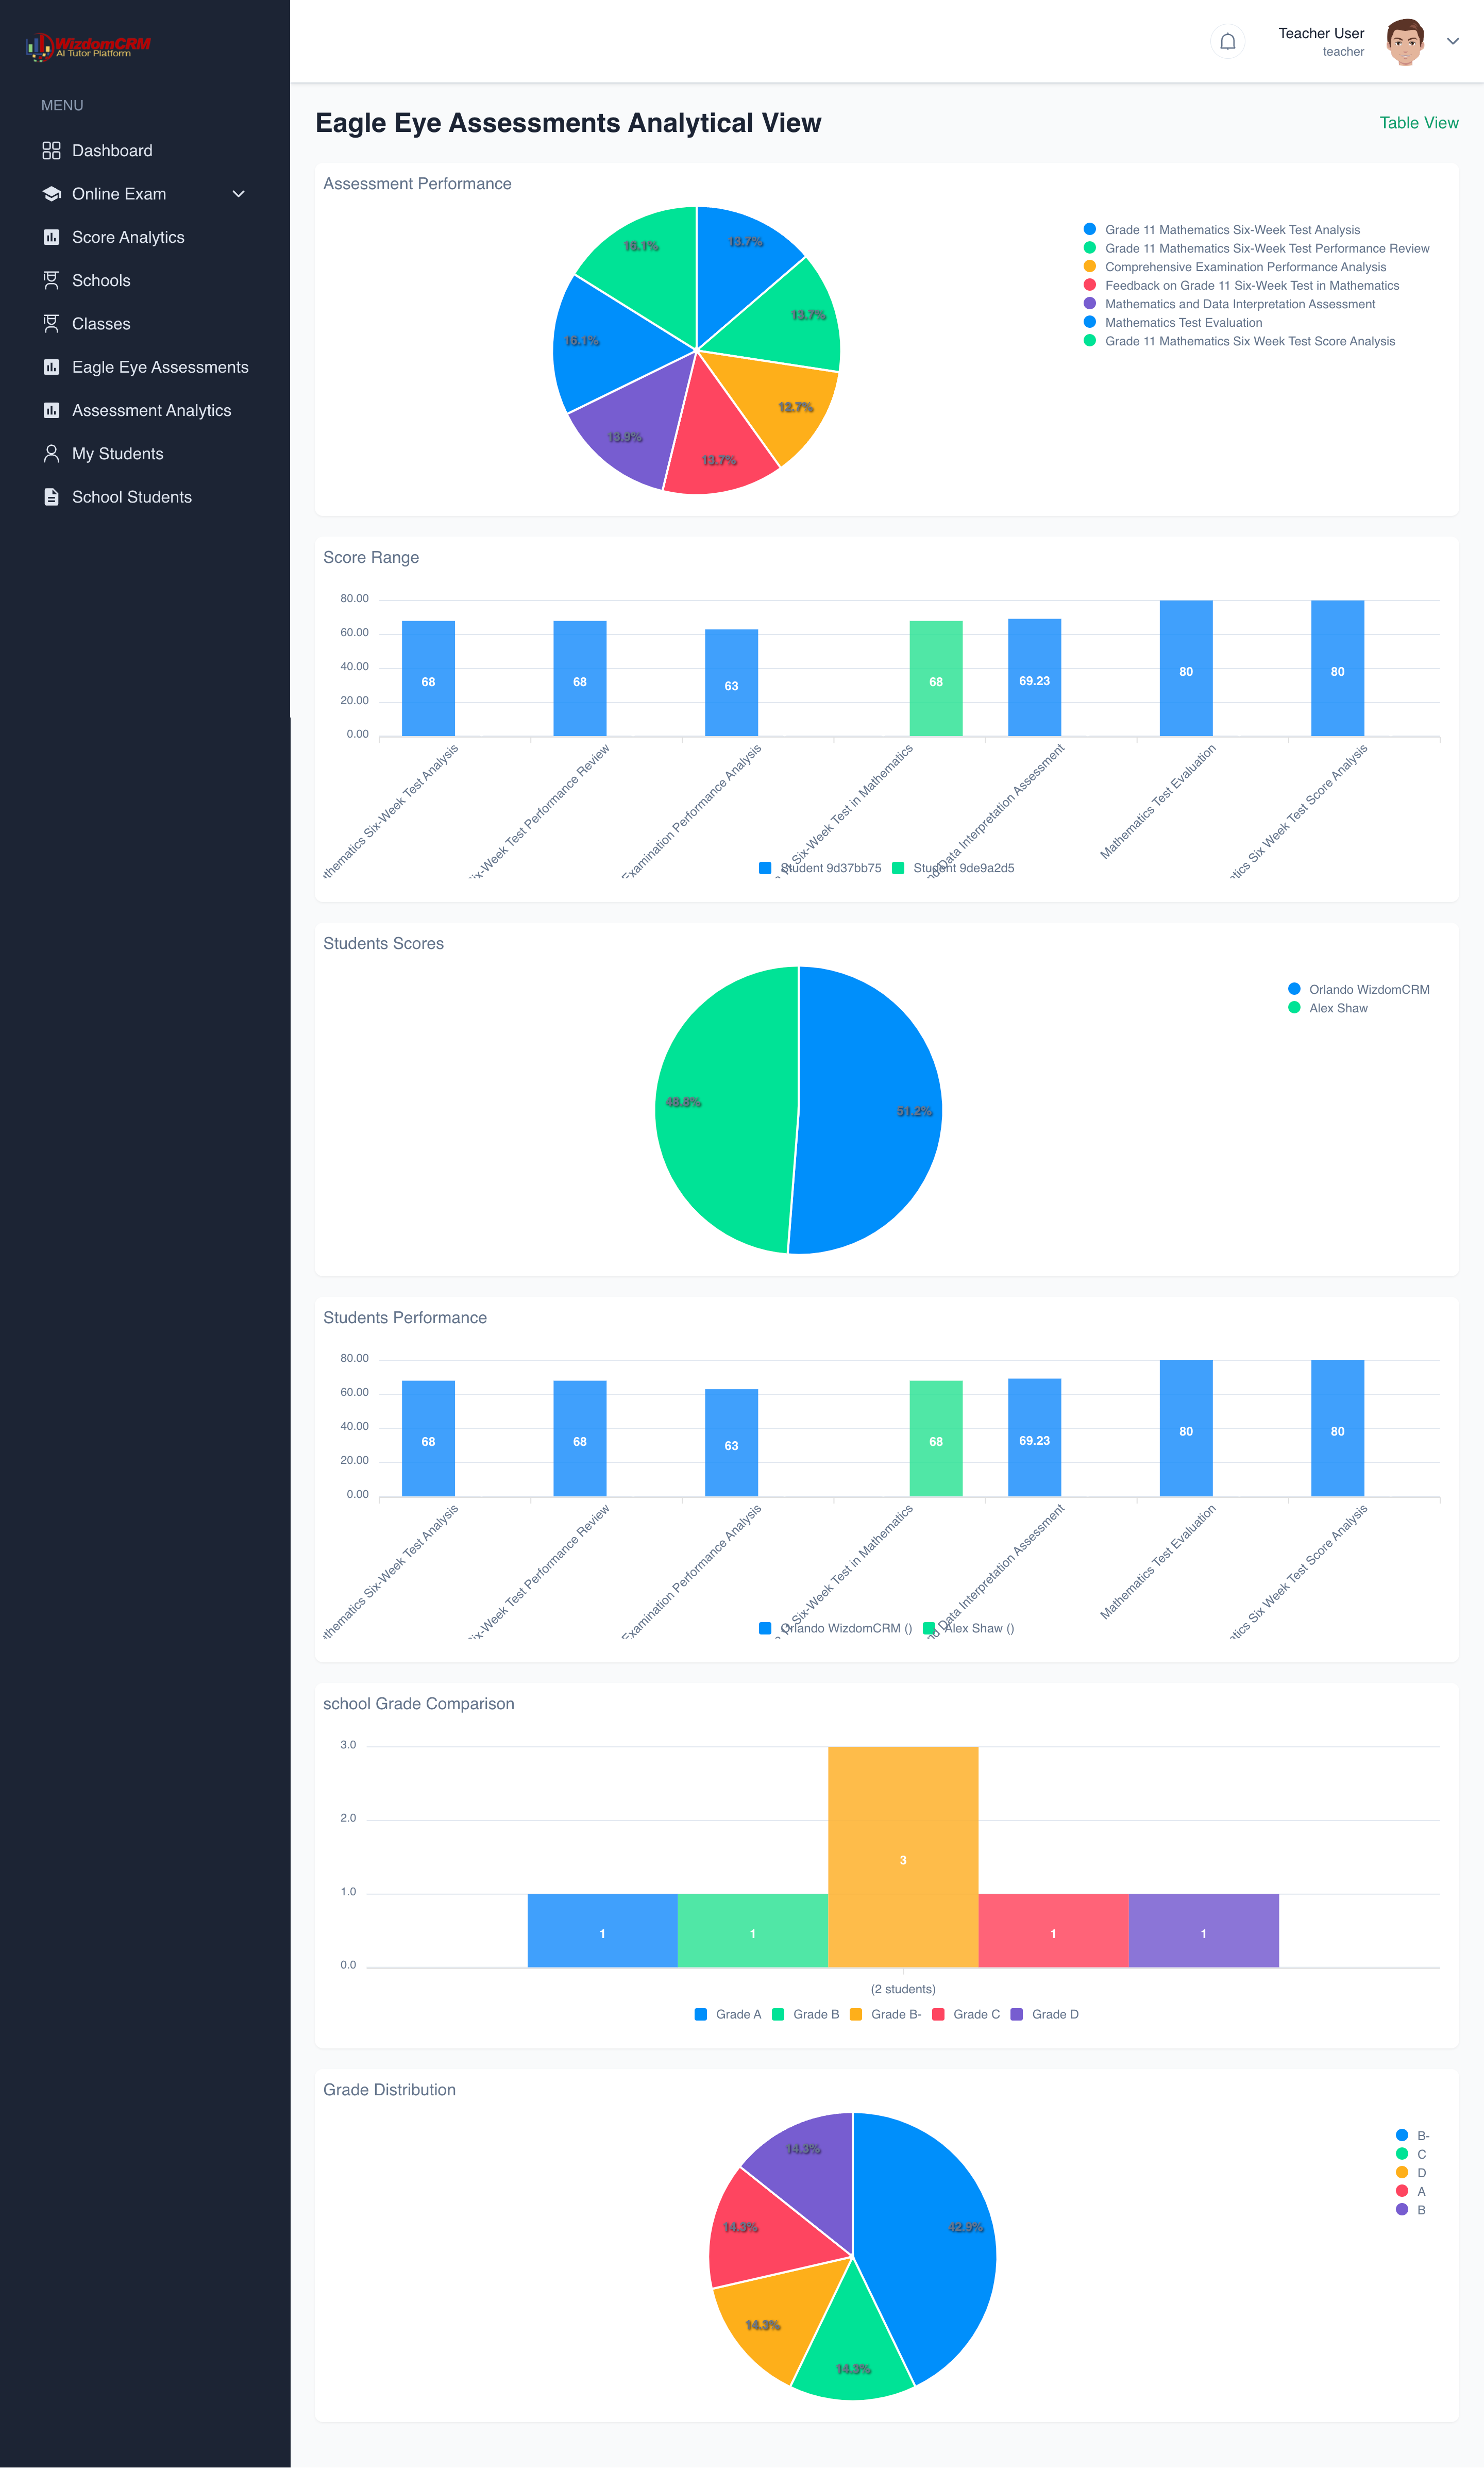
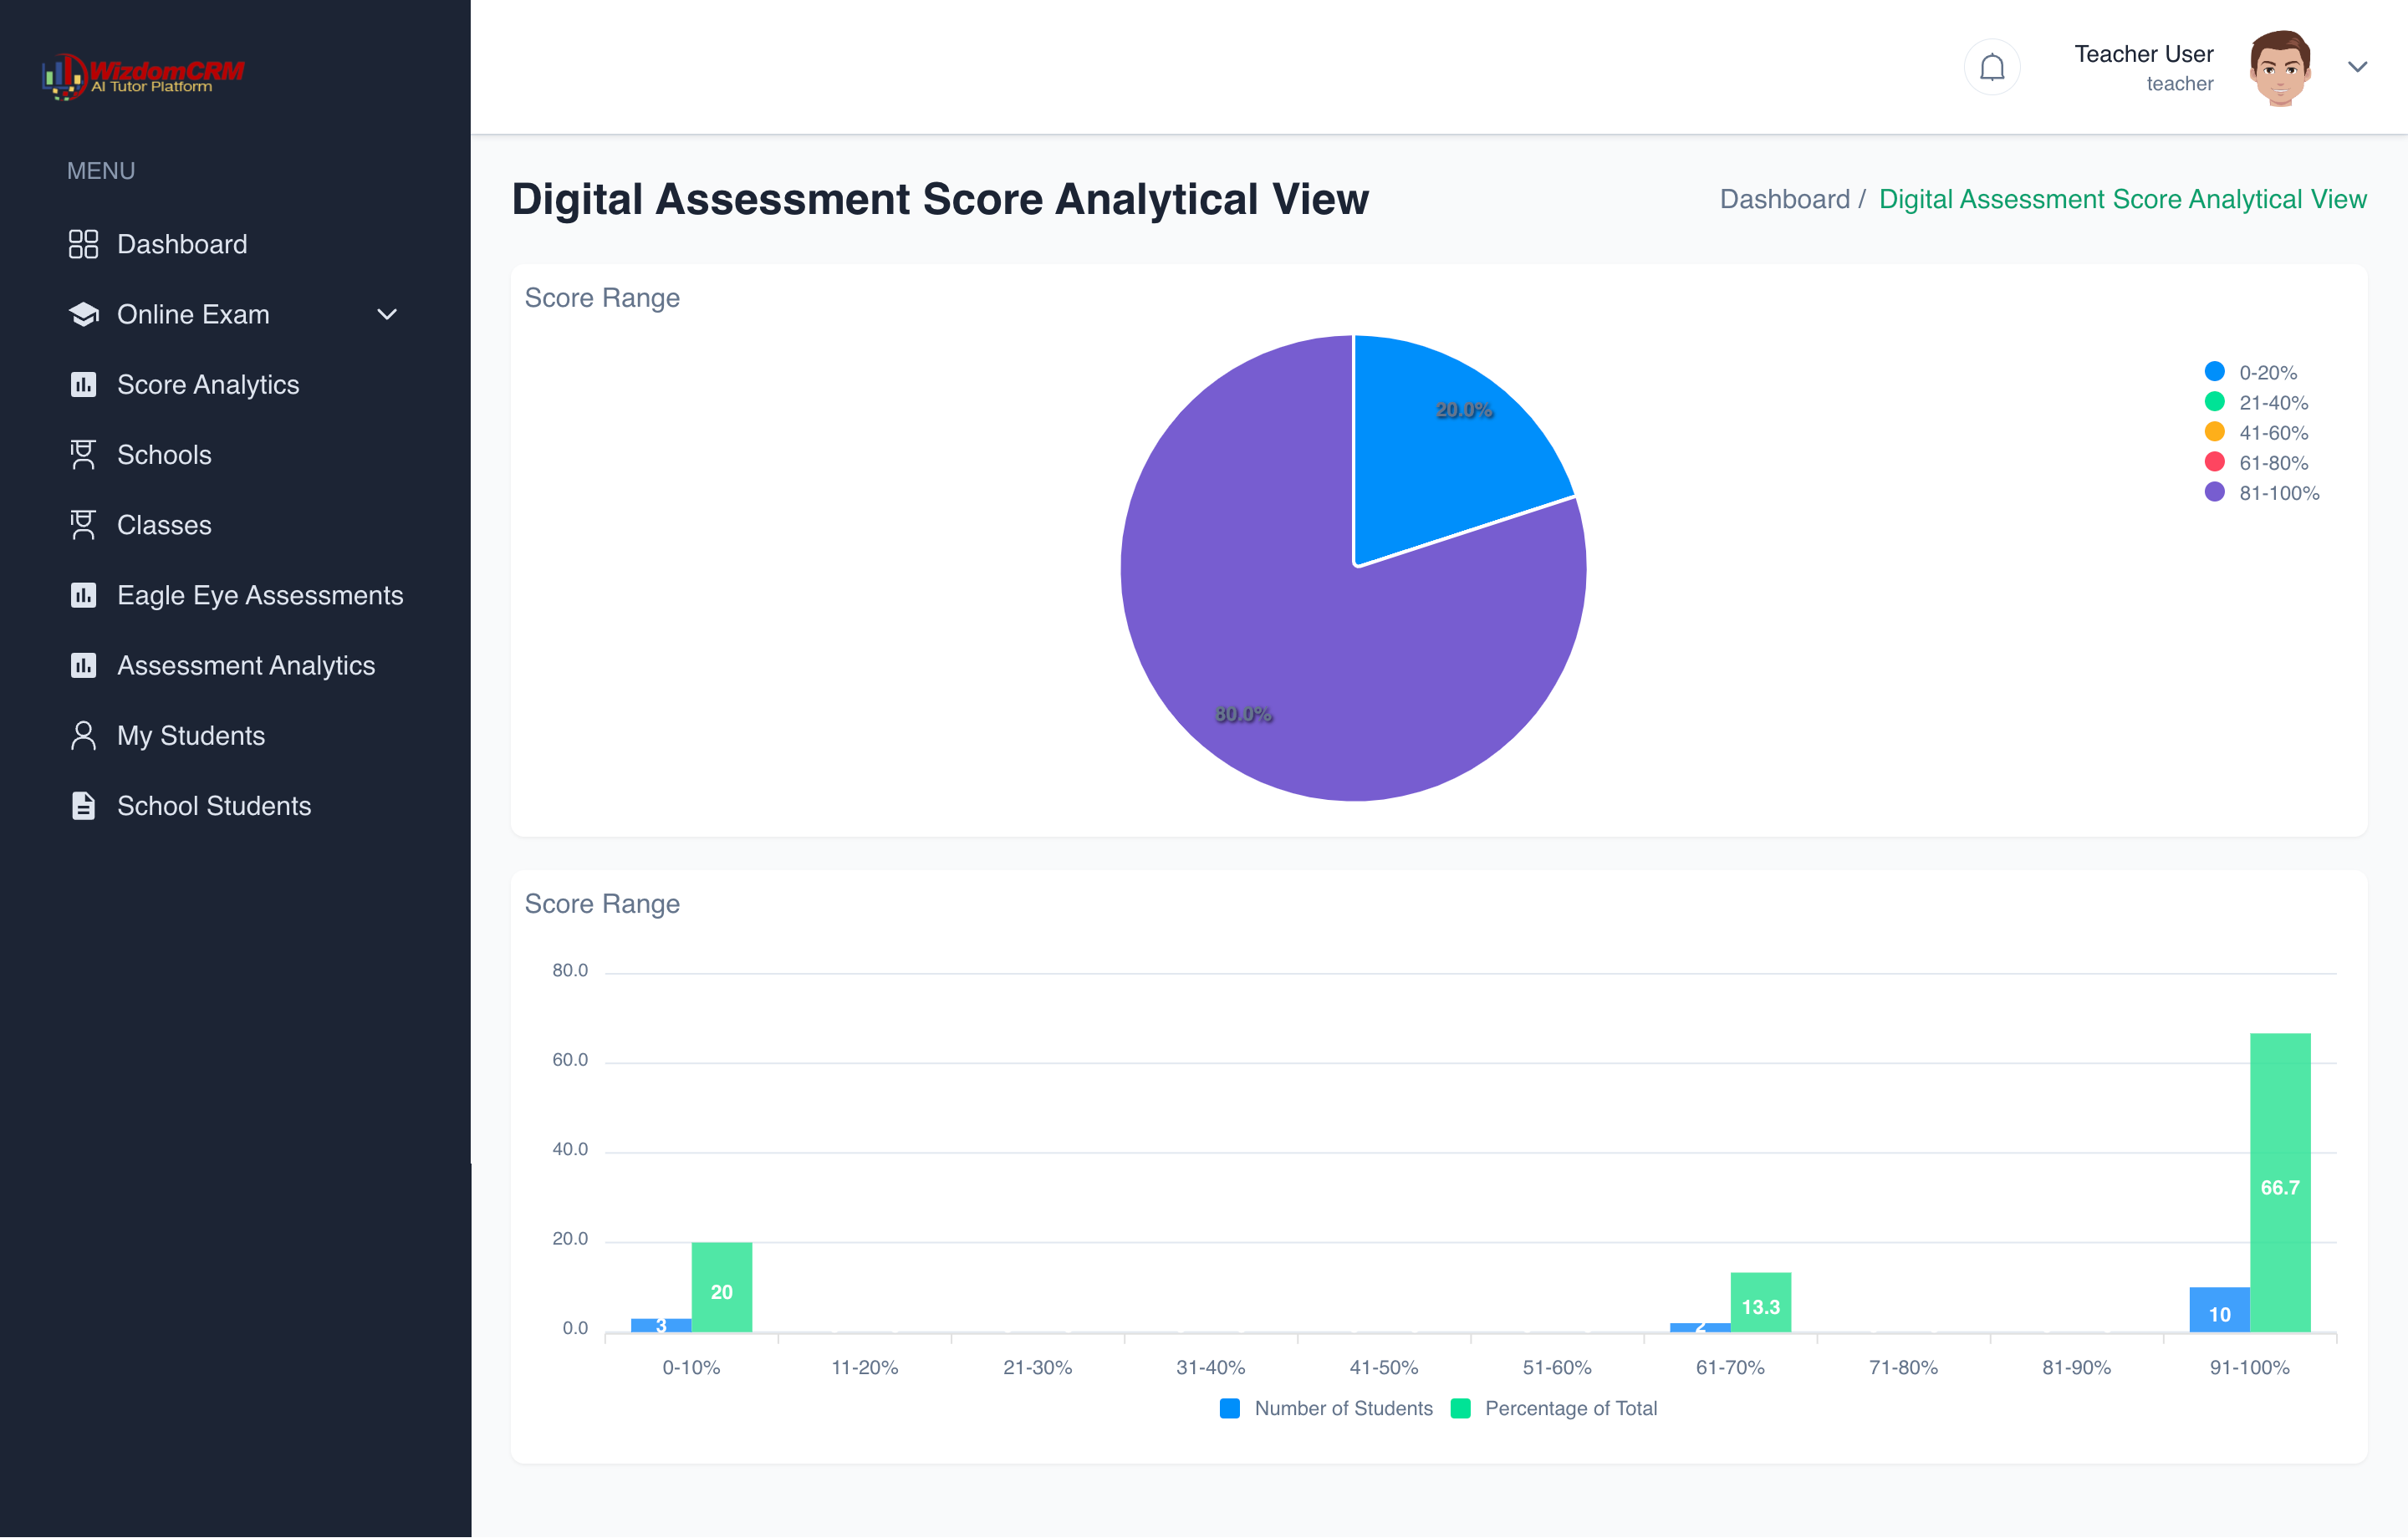
Analytical View Option
In the top-right corner, there's an "Analytical View" link that allows teachers to switch to a more detailed visual analysis of exam results, similar to the Eagle Eye Analytical View discussed earlier. This provides charts, graphs, and trend analysis of the exam performance data.
Visibility Controls
The eye icon in the top-right corner of the results table allows teachers to configure what columns and information are displayed in the table, customizing the view to focus on the most relevant data.
Pagination and Display Options
At the bottom of the results table, teachers can:
- Set the number of results displayed per page (15 per page in the example)
- Navigate between pages of results
- See the total number of results (1 to 4 of 4 results in the example)
Practical Applications
The Exam Results module serves several important educational purposes:
- Performance Tracking: Monitor individual student achievement across different exams
- Exam Effectiveness: Evaluate how well each assessment measures student knowledge
- Completion Patterns: Identify any issues with question completion or time management
- Progress Monitoring: Track improvement over time as students take multiple assessments
- Grade Reporting: Generate accurate records for academic reports and transcripts
Advanced Result Analysis:
Beyond the basic table view, teachers can perform deeper analysis:
- Click on individual student names to see their complete assessment history
- Select specific exams to view question-by-question breakdown of responses
- Generate performance reports for individual students or entire classes
- Compare results across different exam types or time periods
- Export data for use in external analysis tools or reporting systems
Interpreting Exam Results
When analyzing exam results, consider the following factors:
- Perfect Scores: While 100% scores (as shown in the example) are excellent, consistent perfect scores across multiple students might warrant reviewing exam difficulty
- Completion Rates: The ratio of attempted questions to total questions indicates how accessible the exam was
- Time Spent: Unusually short or long completion times may suggest issues with exam design or student engagement
- Pattern Analysis: Look for patterns across students, subjects, or exam types to identify systemic issues or successes
- Individual Progress: Track how individual students perform over time across different assessments